
Learn how this sales team used Coro's MoneyMap to discover an additional $1B in pipeline.
At a Glance
Our client, a $300M business unit within a facilities services company, was ready to rethink their GTM coverage, capacity, different routes to market and how they run their sales motions. After building their MoneyMap and leveraging the Sales Play Generator to target right sales plays to the highest propensity accounts, they generated $1B in new pipeline. Based on historical conversion this translates to $20m in incremental revenue.
Striving for a Better Outbound Sales Motion
With the economy facing uncertain times due to the pandemic, the facilities services industry has cautiously begun to rebound. To stay ahead of its competitors, businesses in this sector need to maximize their revenue in the coming years.
Our client, a business unit focused on the healthcare industry, was generating $300M of annual revenue, mostly though inbound efforts. They believed the outbound sales motion lacked process and predictability. The client was certain they were missing revenue opportunities as a results. In addition, named accounts were assigned to sales teams based on a handful of indicators and rep intuition.
Key Steps: Addressable Spend, Share of Wallet, Propensity to Buy... And Sales Team Buy-In
In order to create a scalable outbound sales motion, it is critical to first align the team on a single source of truth for the market opportunity at the customer and prospect level. This is the foundation for efficient allocation of marketing and sales resources. Their a few key steps to accomplish this:
- Conducting total addressable market (TAM) and share of wallet (SOW) analysis to establish the opportunity built ground-up from the account level
- Developing Propensity scores to identify the prospects most likely to purchase from this company
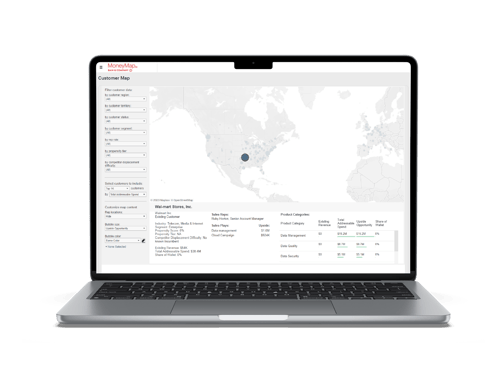
- Building the MoneyMap collaboratively with the marketing and sales teams to create a trusted single source of truth
As is often the case, there was skepticism around existing customer and prospect data: previous models developed internally had not gotten broad traction or use. The collaborative MoneyMap process is built around a clear methodology that can be pressure tested and improved thanks to inputs from sales and marketing individuals and teams. The teams see their inputs reflected in a rapidly improving MoneyMap, which led to the data being trusted by both teams. With this accepted set of data, we could rethink the current sales resource allocation and account tiering.
Next, we used MoneyMap total addressable market (TAM) analysis and share of wallet (SOW) analysis both understand opportunity within each account and within each territory. The TAM analysis showed that territories were not balanced based on opportunity, whether at existing accounts and new accounts. This TAS assessment was particularly effective when combined with the MoneyMap propensity score. Like the MoneyMap, the propensity model is custom-build. This meant that our client could identify which prospective account would be most likely to buy their specific services from them.
Key Changes: Account Prioritization, Territory Coverage, and Sales Play Targeting
Visualizing the results in the MoneyMap application led to striking insights: some reps had too many high propensity accounts to be able to serve them all, and others had virtually none. Even more strikingly, nearly 1/3rd of the high propensity accounts were not covered at all! This realization led to immediate and obvious coverage changes across all territories.
The next step was to build outbound sales plays and aim them at the right accounts. The MoneyMap made it easy for our client to shortlist the accounts most likely to purchase for each individual sales play. This allowed the sales teams to pilot the outbound sales process with accounts that were the most likely to be amenable to cold outreach. The success in this motion was infectious and led to widespread sales adoption.
Results: Massive Pipeline Opportunity and Immediate Payback
Our client was impressed by results of leveraging the MoneyMap to improve their sales motions. The first sales play run with MoneyMap generated $1 billion in pipeline, and it is anticipated to close $20 million of incremental revenue by the end of the fiscal year based on their historical conversion rates. The revenue growth and results serve to reinvigorate the GTM.
“I wish I had MoneyMap a year or two ago! It helps us focus our Go-To-Market efforts on accounts with the highest propensity to expand or buy."
- FSHCo Chief Commercial Officer
Finally, the data foundation enabled FSHCo to track their progress and measure the results of the sales transformation. With the data collected, the team was able to monitor the success of the outbound sales motion, measure the impact of the territory rebalancing, and track the revenue generated from the new hires. This allowed the team to continually refine their strategy and ensure that their efforts were resulting in tangible success – and to immediately see a massive payback on their transformation project.
